Quick use of PecubeGUI
This part aims to provide a quick overview on how to provide paramaters to run Pecube as is usually done with a terminal. For more details about extended tools provided with PecubeGUI, please refer to Extended usage.
Create a new Pecube project
To create and run a new Pecube project, go to New input file or press Crtl+N (3, see Introduction), a widow pops up and ask you to provide the name of the new project (Figure 2). After clicking the “Ok” button (Figure 2), you will be able to provide and set all the Pecube input parameters for your project.
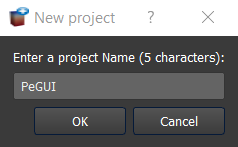
Figure 2. Enter a new project name. This window shows up when clicking on the “New input file” action.
The window should look like the Figure 3. On the top left, you could find and access all the projects you have loaded into the interface, and thus navigate through their respective parameters. The right part of the interface will host extra input parameters described in Extended usage.
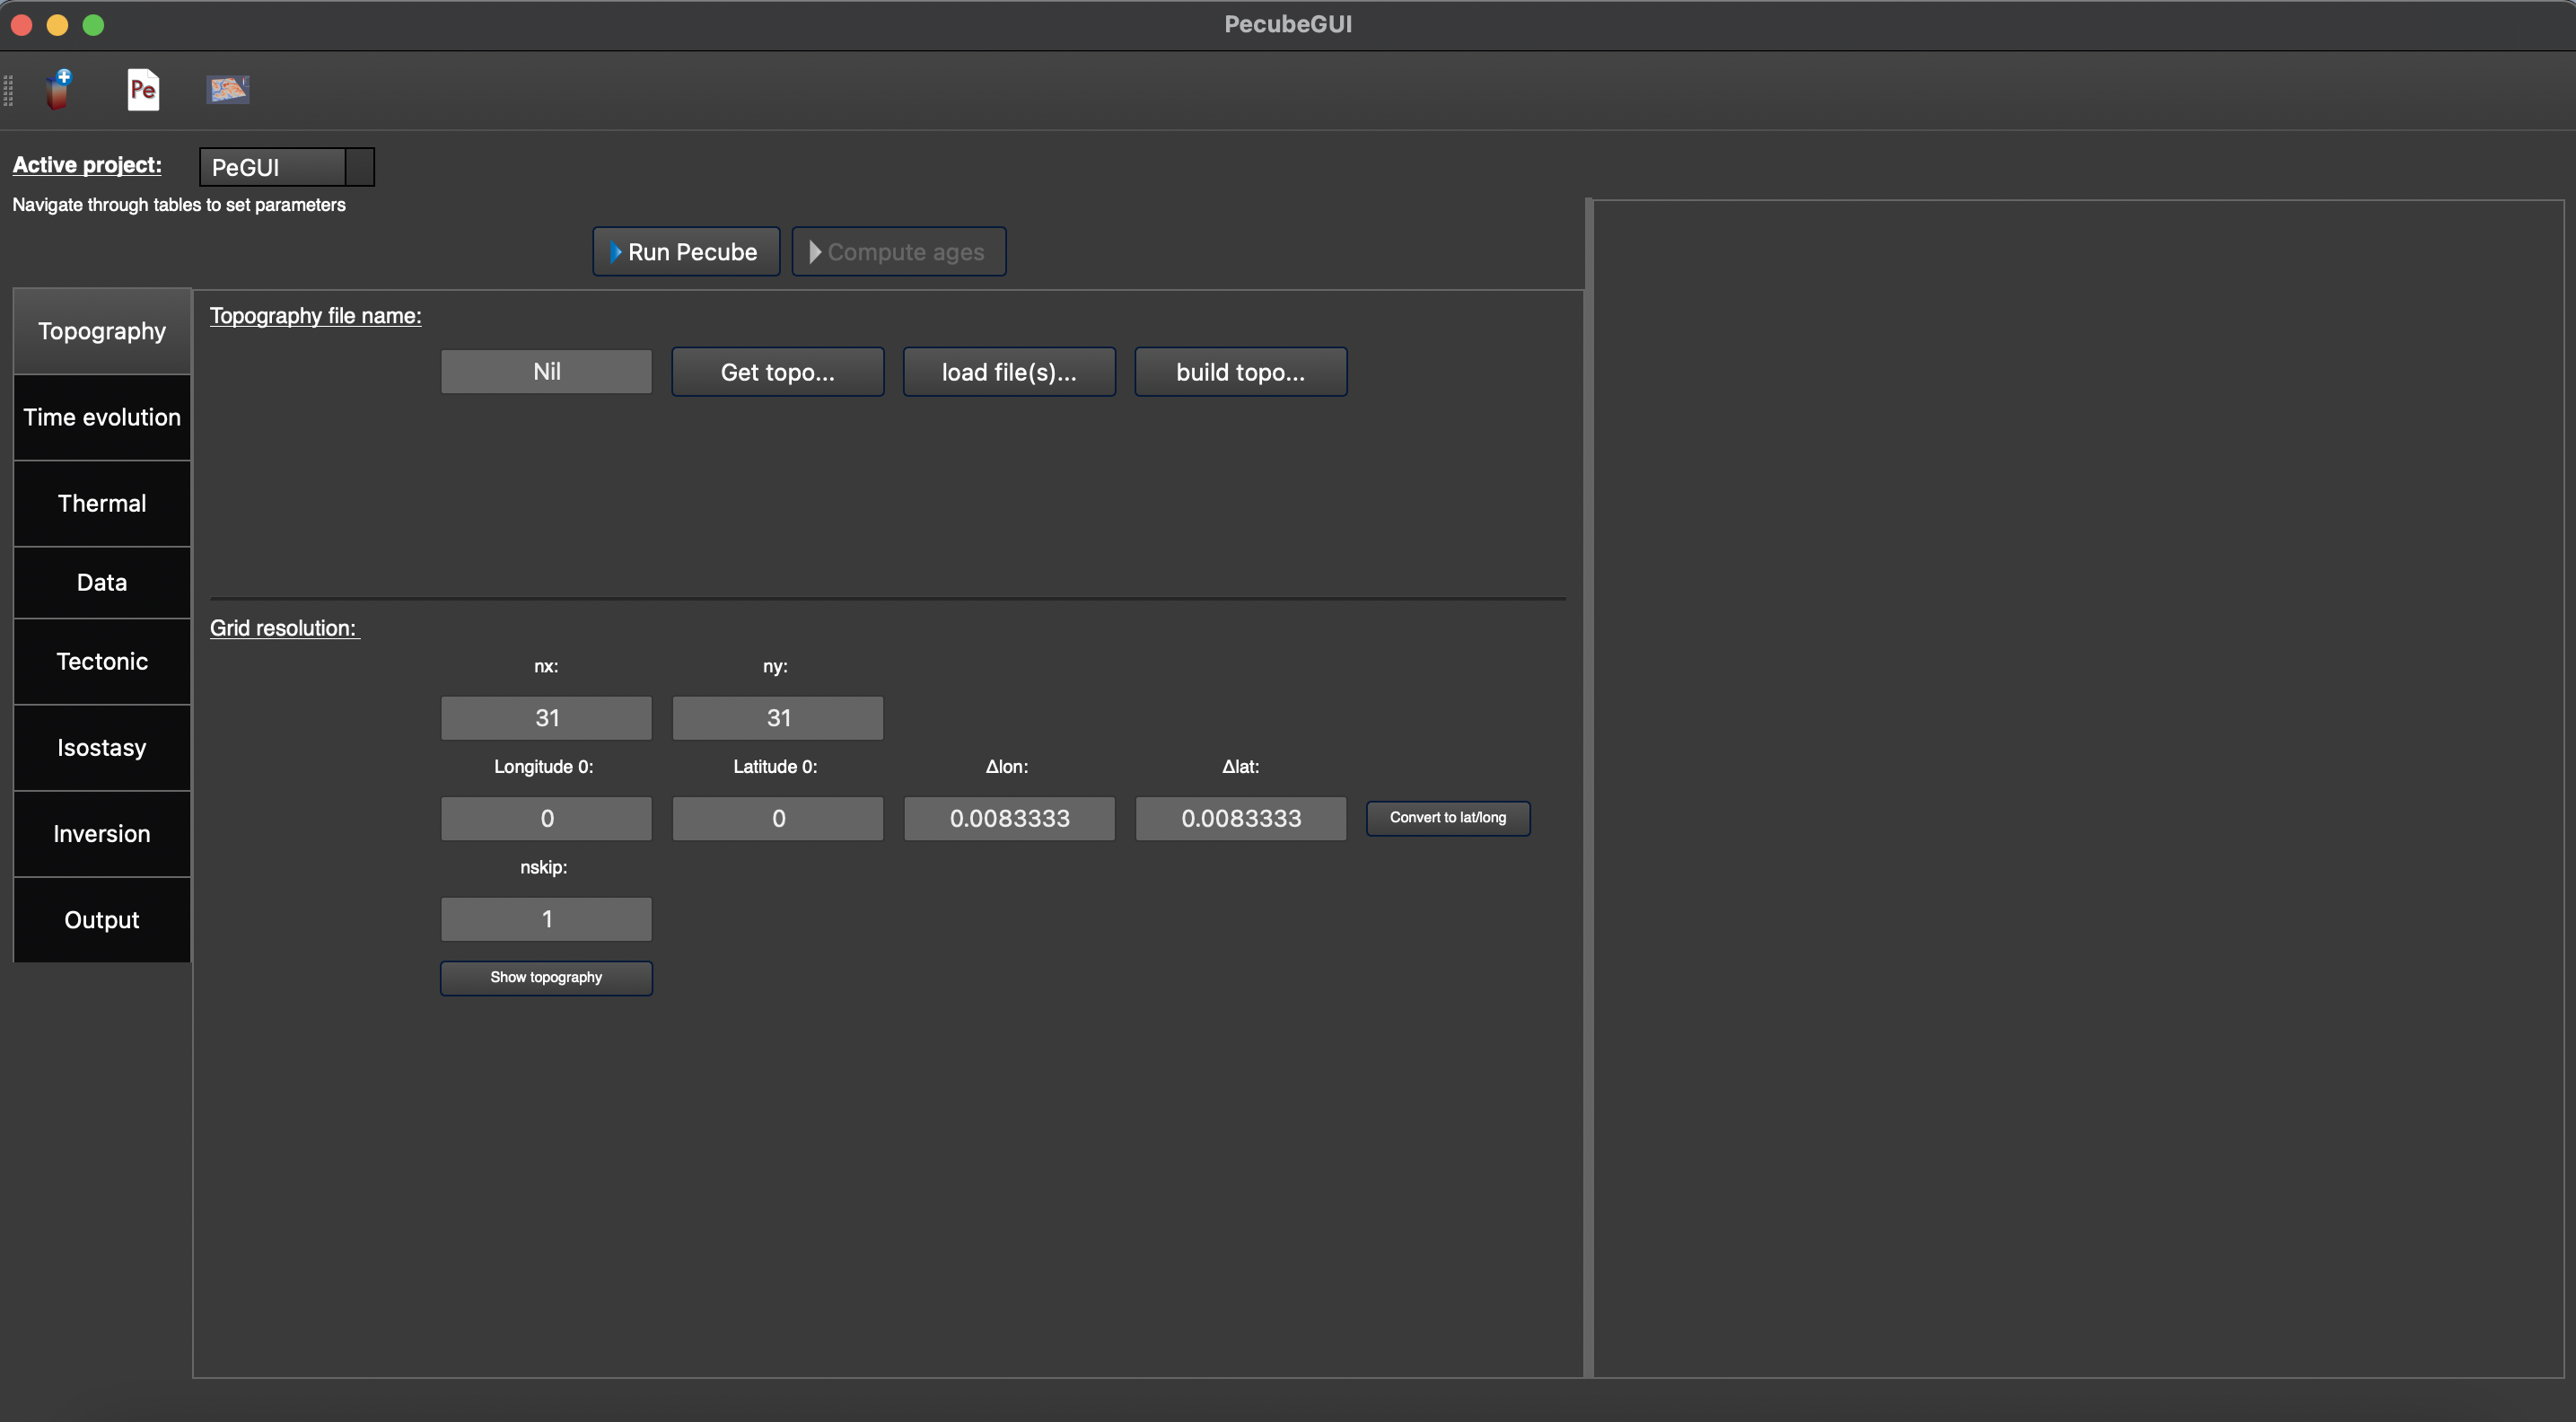
Figure 3. Tab to set up the input parameters for Pecube. On the top left, you can check the name of your project (here: ‘PeGUI’)
The input parameters are gathered into categories similar to what is found in the Pecube’s user guide. All the parameters are sorted in 8 categories: Topography, Time evolution, Thermal, Data, Tectonic, Isostasy, Inversion, and Output parameters. For more details on the meaning of each input parameter please refer to the Pecube’s user guide. However, you could access to a short description of each parameter by simply flying the mouse cursor over the parameter labels. After one second a text should appears and describe the parameter.
Provide input parameters
Topography tab
Time evolution tab
In this tab (Figure 4) you can provide all the parameters that control the time evolution of the Pecube model. In PecubeGUI you can provide the time evolution parameters (cf. “time_topo”,” amplification”, “offset”, and “output”) by filling in the table or by copying/pasting values from an excel file to the table. The number of rows in the table automatically adapts to the value written in the parameter “ntime” (Figure 4). You can also set the reference elevation from which to scale the input topography.
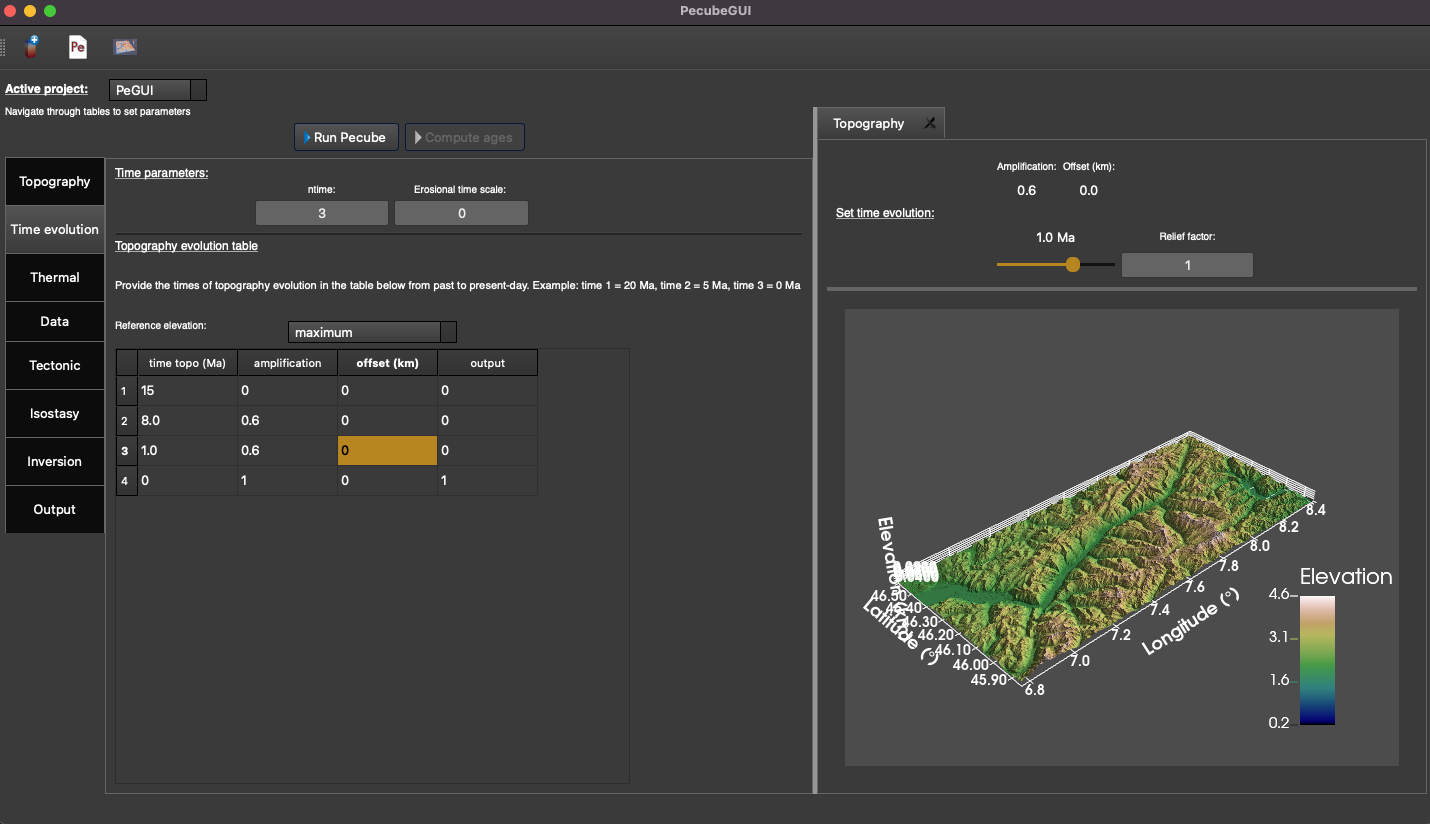
Figure 4. “Time evolution” tab where to provide parameters related to the time evolution of the topography.
Thermal tab
Tectonic tab
no uplift: compute the effect of topographic change only on thermal field
bloc uplift: vertical movement of the entire domain
faulting: slip rate along fault(s)
Note
To define the type of fault, we keep on the convention described in the Pecube’s documentation. To define a thrust the velocity has to be negative, a positive velocity means a normal fault (i.e., ‘velo’ in the table).
The order you define the position of the points of the fault(s) matters. The convention is that the fault geometry is defined to the right of the strike of the fault (see Pecube’s documentation for more details)
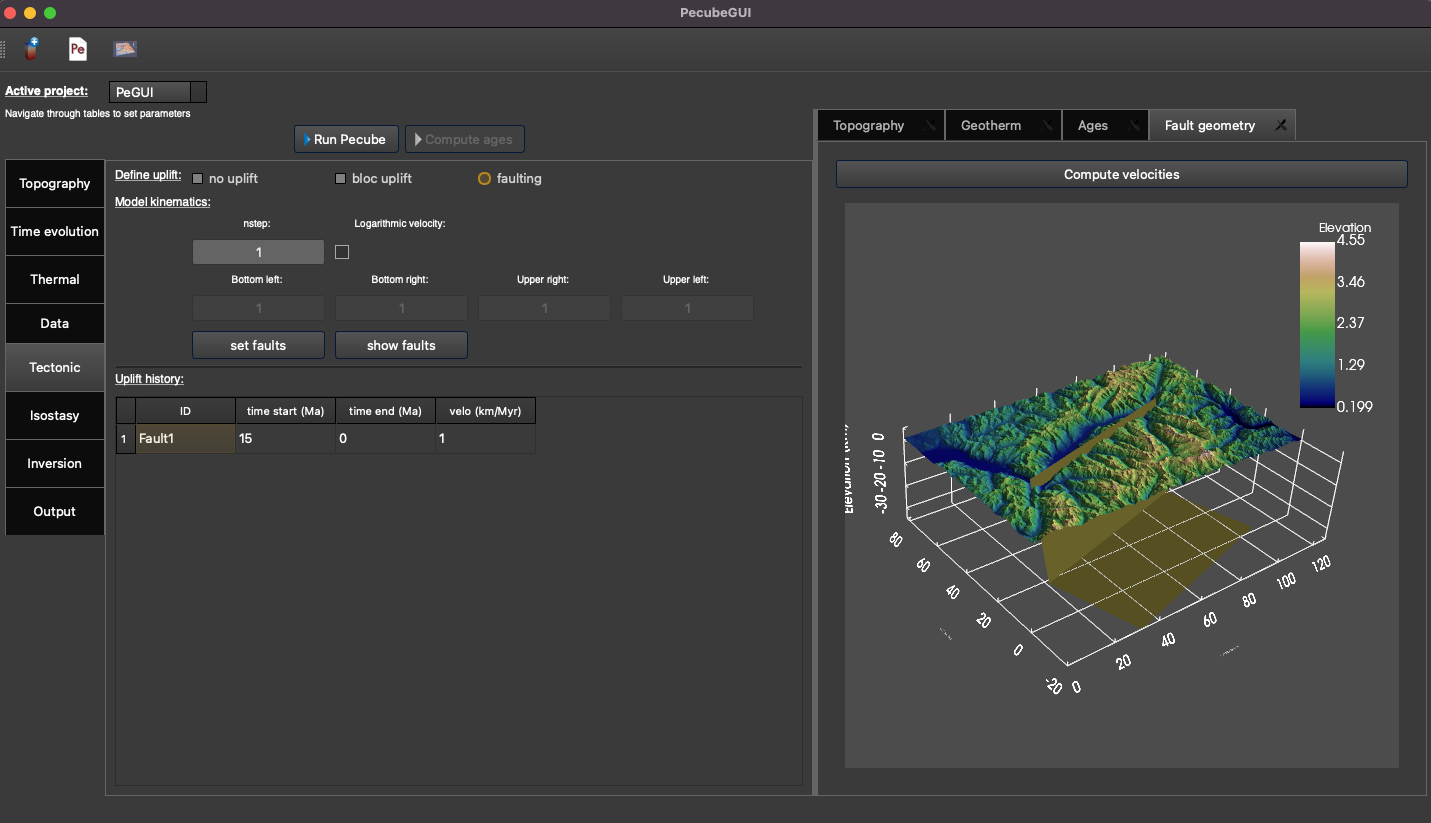
Figure 5. “Tectonic” tab where to provide parameters related to kinematic of rock uplift.
Data tab
This tab enables the user to set the outputs he/she wants that Pecube provides at the end of the model run. The first part (i.e., “Compute ages”) let you choose between three options:
none: Pecube will not predict any thermochronological ages
for all nodes: Pecube will predict thermochronological ages for all nodes at the surface of the Pecube model.
sample specific: Pecube will predict thermochronological ages only for specific sample locations provided by the user. For this option to work, you will need to provide a folder name where PecubeGUI will write some files that will be used by the Production-diffusion model. This has to be done in the Data tab in the “Data folder” text box.
The remaining tabs do not need detailed descriptions. Simply fill the text boxes with your new values. The details for each input parameters can be found in the Pecube user guide, and short descriptions can be seen when flying the mouse cursor over the label of each parameter.
Run a Pecube model
Note
When several projects are opened, the consoles are gathered in a single window to have a quick overview of all the running simulations.